Question
We need to try and fit a piecewise linear (PWL) function to the I/B calibration curve.
Hypothesis
What are our assumptions?
Experiment
Propose a methodology to test the hypothesis.
Results
This is the I B calibration function with 91 points.
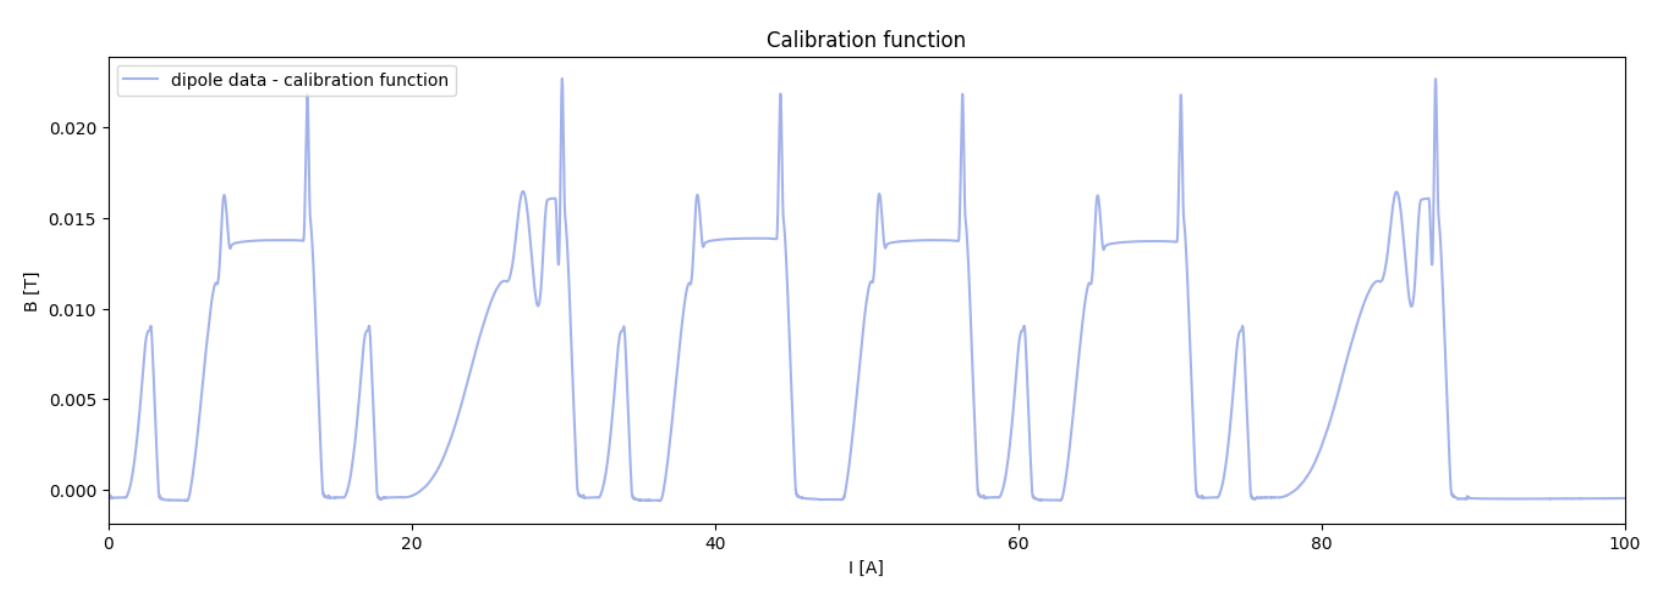
It fits I/B pretty well but leaves peaks at the start and end of flat top.
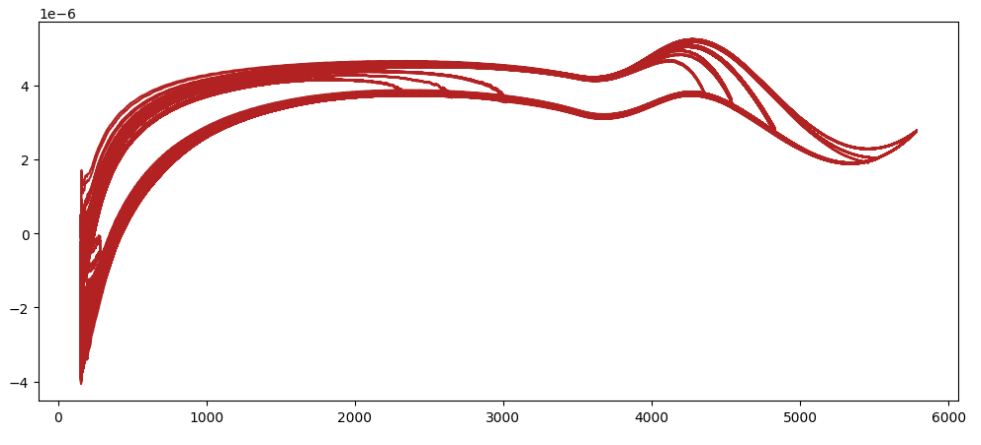
Dividing B by I and plotting vs I we see significantly more information at flat bottom.
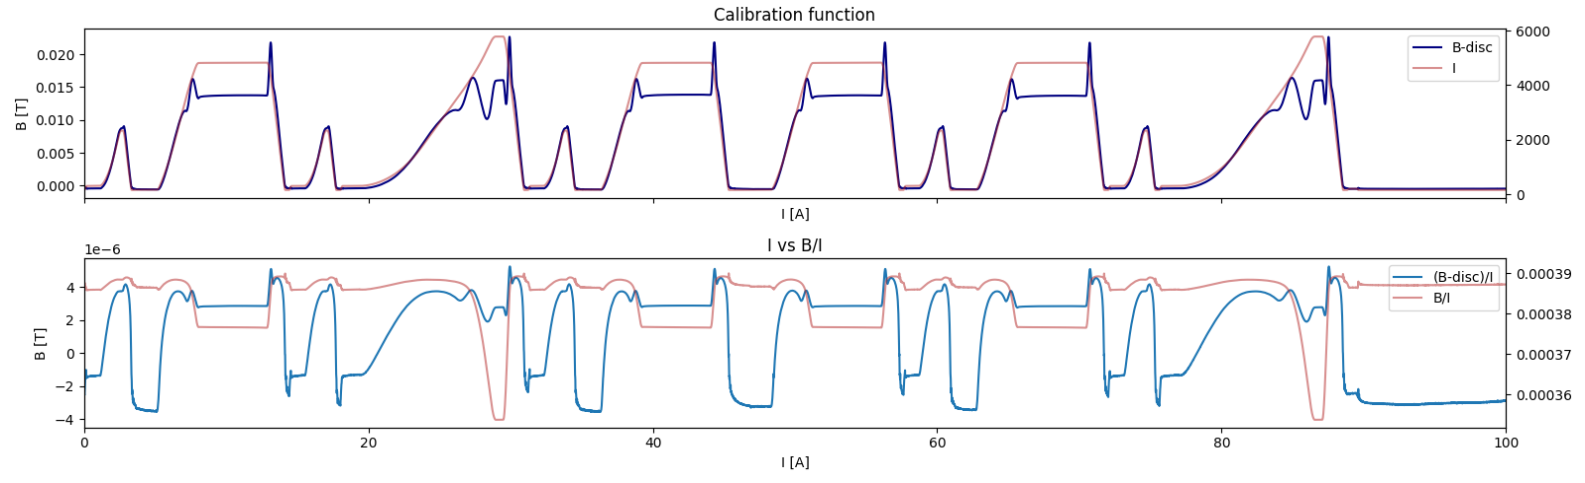
When subtracting B with the discrete function values we see significantly more information at flat bottom with more pronounced decays
We try to fit a function using torchpwl, the notebook is available at ~/cernbox/hysteresis/dipole/notebooks/subtract_discrete_function.ipynb.
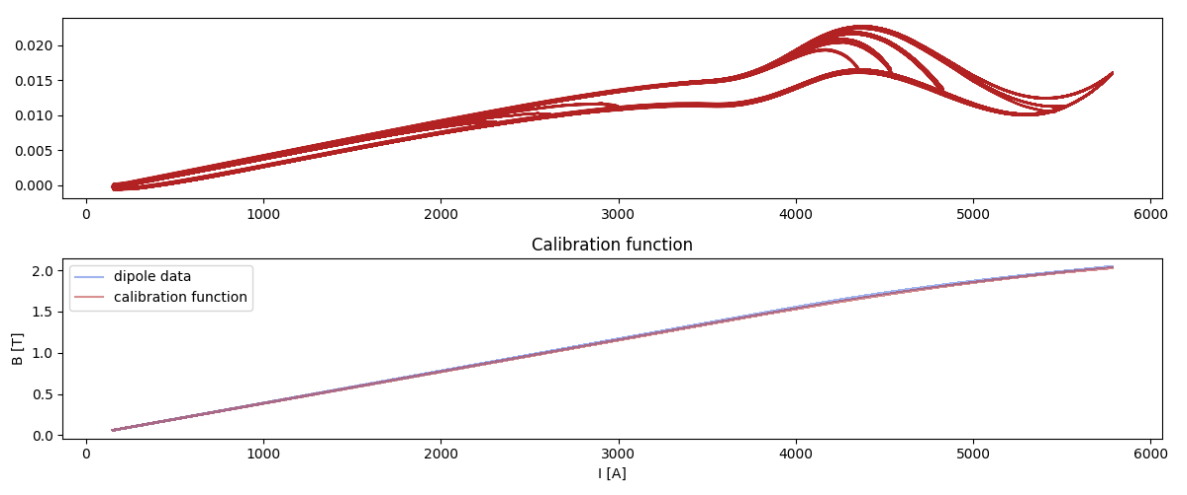
Training 2000 epochs it shows the following fit with 200 keypoints:
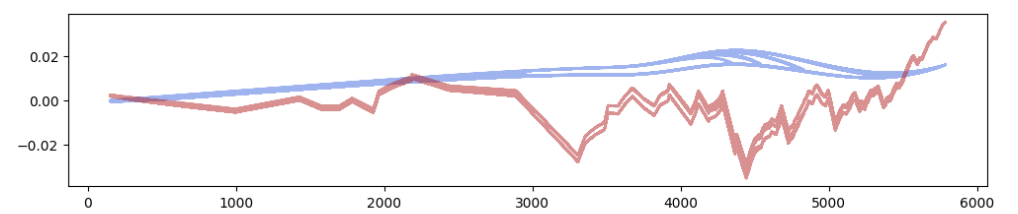
Where the blue shows the original calibration fuction and red the fitted one.