The voltage of the magnet coil (not fluxmeter) is continuously measured by the FGC internally to regulate the current in the circuit, and was previously not published externally, however since the 2024/2025 YETS, it can be acquired from NXCALS.
Coil voltage
The voltage of the magnet coil can be divided into 2 components, an inductive and a resistive load.
A resistive load is a type of electrical component where the voltage across it is directly proportional to the current flowing through it, according to Ohm’s Law. In this case, voltage and current are always in phase, and the relationship is given by
where is the voltage across the resistor, is the current, and is the coil’s resistance.
An inductive load, such as the coil in a magnet, stores energy in a magnetic field as current passes through it. When the current is not constant, the changing magnetic field induces a voltage that opposes the change in current by Lenz’s Law and Faraday’s Law of Induction. The voltage across the inductor is
with as the inductive voltage, as the inductance, and representing the rate of change of current. The inductive part is what is induced by the electromotive force, in the way as for Measuring magnetic fields.
Thus, the total voltage you measure across a real coil powering a magnet is the sum of these two components:
The term is the resistive drop due to the coil’s resistance, and is the inductive voltage resulting from variations in current and the associated magnetic field.
Typically, a power converter (or current regulator) supplies the voltage needed to keep the coil current at a set reference. The converter adjusts its voltage output so that matches the commanded reference, compensating for both the resistive and inductive requirements.
Change in resistance
The resistance of a copper coil can be affected by both short-term and long-term changes. Here, we distinguish these categories and focus on short-term effects in detail:
Short-term changes:
The most significant short-term factor is temperature. As the current passes through the coil, Joule heating causes the temperature of the copper to rise. The resistance of copper increases with temperature according to the relation
where is the resistance at reference temperature , is the actual temperature, and is the temperature coefficient, which for copper is about @dellingerTemperatureCoefficientResistance1911. For example, heating a copper wire from 20°C to 70°C results in a resistance increase of approximately 20%:
The resistance of a copper coil can also be influenced very slightly by the magnetic field generated by the iron core, a phenomenon called magnetoresistance. For copper at room temperature, this effect is extremely small compared to temperature-dependent resistance changes. Experimental data shows that in a transverse magnetic field of 10 Tesla, copper resistance increases by about 0.25 % @delaunayMagnetoresistanceCopper1959. Since the effect is quadratic in field strength, the change in resistance can be estimated as:
where is the magnetic field in Tesla, and is an empirical constant. Using the data point ( at ):
Therefore, for fields between 0 and 2 Tesla in Normal conducting magnets
So for normal SPS Magnets, the resistance can theoretically change up to 0.01 % as the magnet is pulsing.
Mechanical stress, such as tension or compression, can also cause short-term (and potentially reversible) changes in resistance. According to early studies, the change due to mechanical strain is typically small compared to temperature effects, but repeated bending or stretching can cause local increase in resistance due to work hardening. @XXInfluenceStress1886
Long-term changes:
Over time, factors such as oxidation, corrosion, creep, and stress relaxation can alter resistance. For copper, surface oxidation rarely impacts electrical conductivity unless the degradation is very deep—thin oxide layers are essentially non-conductive but do not significantly affect bulk resistance [85]. Long-term exposure to corrosive environments or sustained mechanical stress (creep, microcracking, or stretching) can result in a gradual, often irreversible, increase in resistance [79][84].
References:
- NBS (now NIST): The temperature coefficient of resistance of copper [57]
- Cirris: Temperature Coefficient of Copper [58]
- Royal Society: Physical effects of stress and strain on resistance [89]
- Electronics Stack Exchange: Copper oxide and resistance [85]
- SSRN: Fatigue properties and corrosion in copper wire [79]
- NJIT: Creep and stress relaxation in copper wire [84]
Reconstructing magnetic field from coil voltage
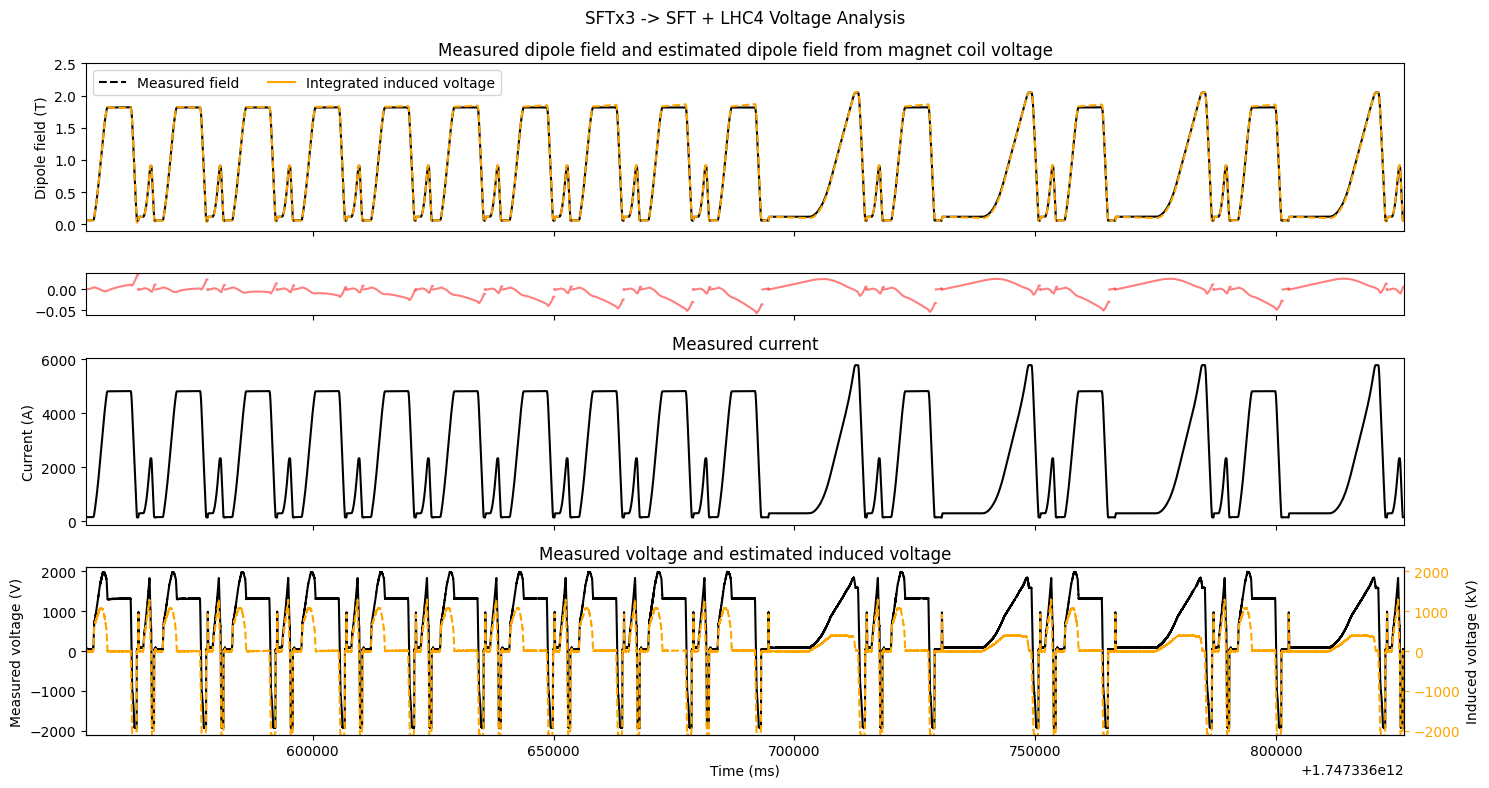
By estimating the resistance of the coil, we can subtract the resistive component, and leave mainly inductive voltage. The inductive voltage is then integrated over time, and calibrated to the measured magnetic field acquired from the B-Train. Through an optimization loop, we find that the estimated resistance is , and calibration factor for the specific dataset SFTx3 → SFT_LHC4, seen below.
The optimization is performed by, for each cycle, taking a resistance , subtracting the resistive component, integrating the voltage, and calculating the calibration factor as the largest ratio between measured field from the B-Train and the reconstructed flux, and taking into account the integration constant by using the initial measured field. The calibrated flux is then compared to the measured field with a standard MSE loss.
For a range of possible resistance values:
    For each cycle in the dataset:
        1. Subtract the resistive voltage from the measured voltage.
        2. Integrate the resulting voltage to estimate magnetic flux.
        3. Compute a calibration factor to match the estimated flux to the measured magnetic field.
    Use the calibration factor to scale all estimated fluxes.
    Concatenate all estimated and measured magnetic field values.
    Compute the mean squared error (MSE) between estimated and measured values.

Select the resistance value that gives the lowest MSE.
Compute and store the corresponding calibration factor.
Since the resistance of the coil is not constant, we see imperfect reconstructions in the second plot with red line, where reconstruction errors up to can be seen, which equates to a 2.5 % reconstruction error, significantly higher than the field tolerance required by the beam.
 As the
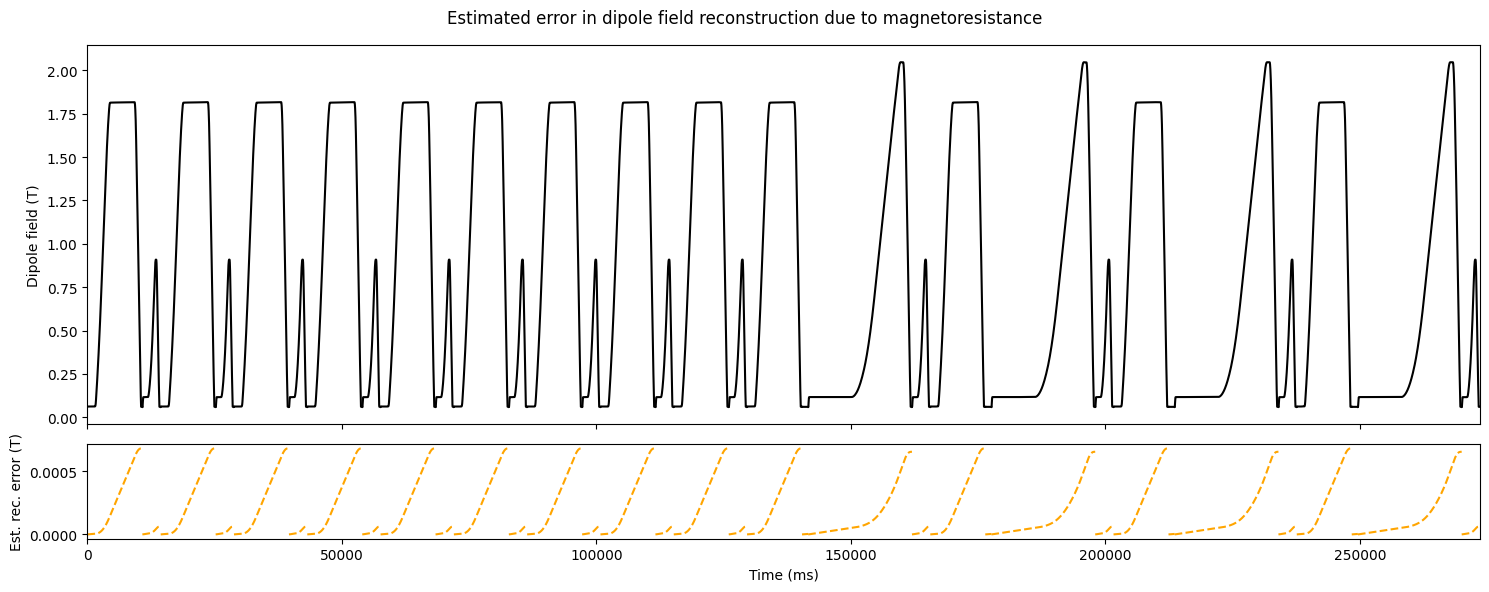
With a , and reconstructed magnetic field as
and with possible mismatch in resistance , the estimated field error becomes
Which is shown in dashed orange in the plot below. We see that the the maximum field deviation due to 0.01 % resistance change is , 2 orders of magnitude lower than the difference between measured and reconstructed field in the plot above.
Plotting the residual voltage (filtered), one can see that the voltage follows discrete lines for each cycle, likely dependent on the ramp rate.
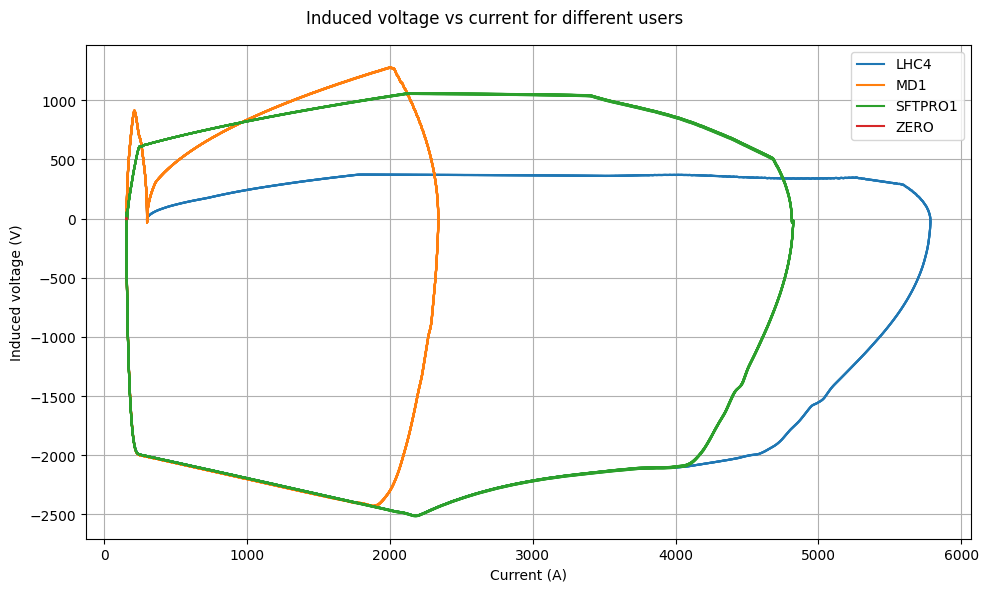
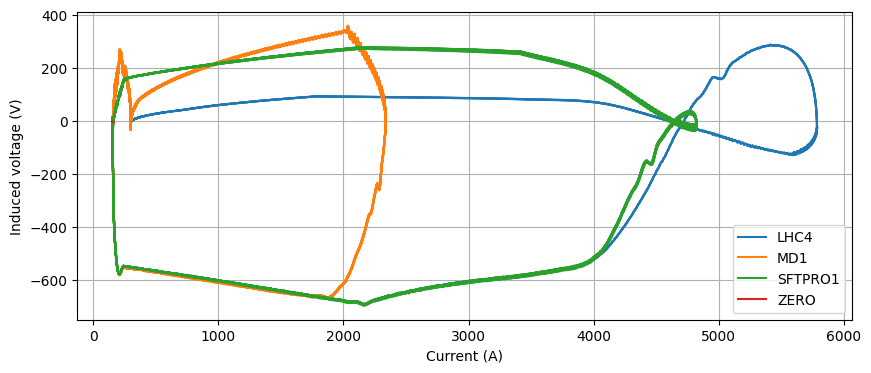
Coil voltage vs current
Now plotting (reference) current derivative against the induced voltage, we see a clear relationship between the induced voltage and current derivative.
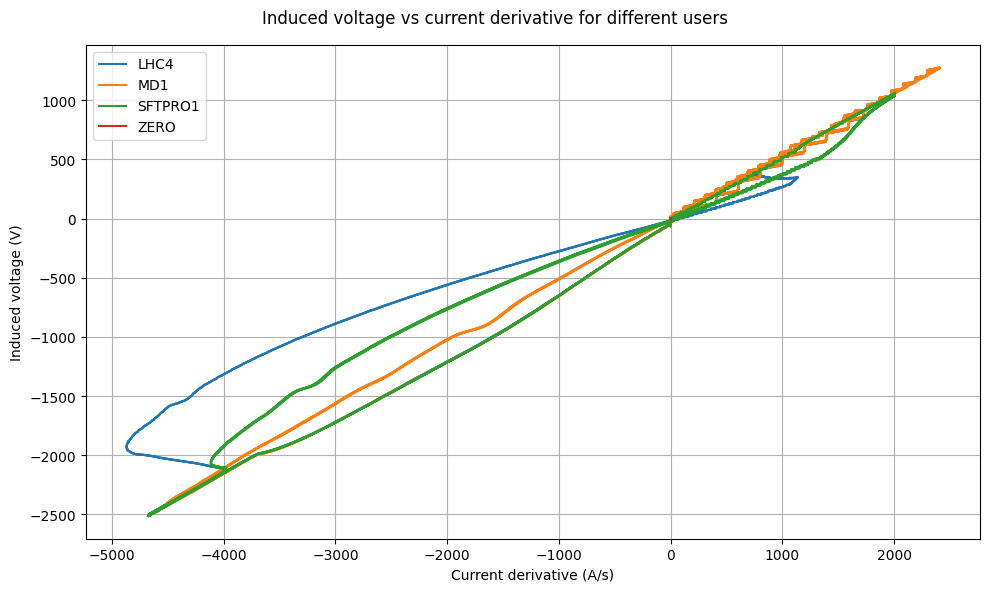
If you subtract you see the following phase-space, which is something that potentially can be modeled by a neural network.